Home/Case Studies

Not a case study. The actual screen.

Advertising console exports and profit dashboards, straight out of live accounts. Brand names and search terms are removed. Nothing else is, and the baseline is always still in the frame. Click any screen to read it full size.

Best month shown
$5.89M
Lowest TACOS shown
8.68%
Best new to brand share
81.5%
Impressions on this page
153M
01

Profit and Growth

What the business did, not what the ad tab did. Profit dashboards and revenue charts, compared against the same period a year earlier.

Amazon Profit dashboard, June this year against June last year
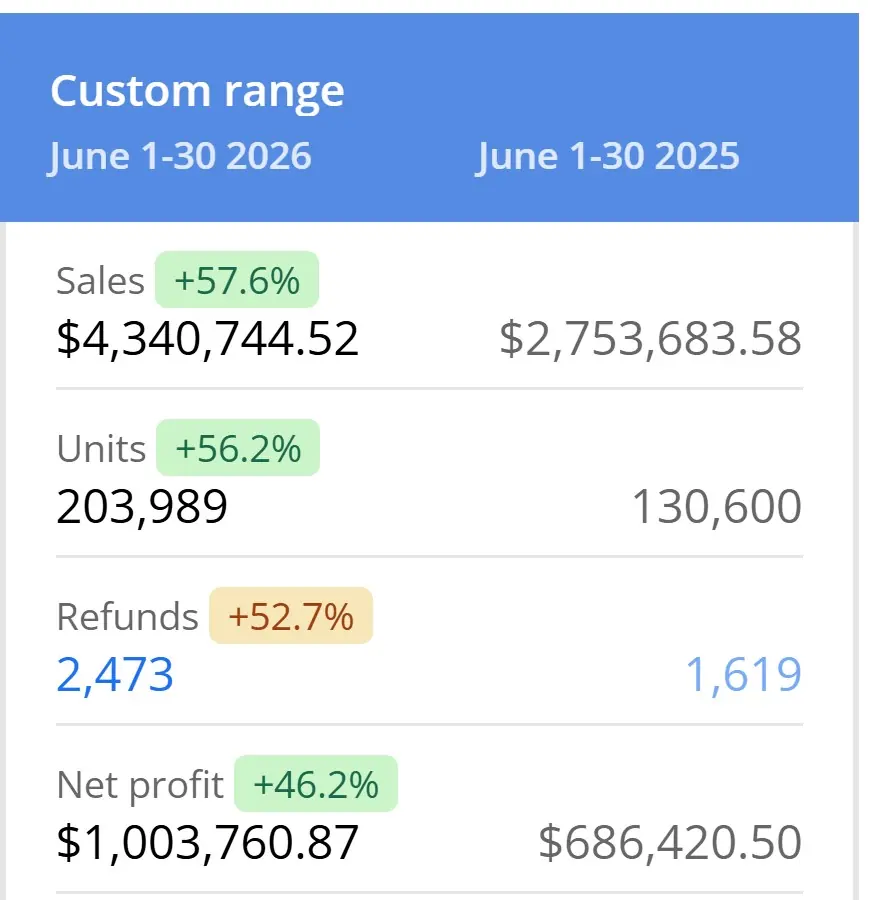
Profit dashboard comparing June 2026 with June 2025
Amazon · June year on year

A year of work, read off the same thirty days a year apart

June 2026 against June 2025. The growth on the left took a full year to build, and this is where it landed: sales up 57.6%, units up 56.2%, and net profit past a million dollars in a single month for the first time. The 2025 baseline is in the screen on the right, where it belongs.

June sales
$4.34M
from $2.75M a year earlier
Units
203,989
from 130,600
Net profit
$1.00M
from $686K
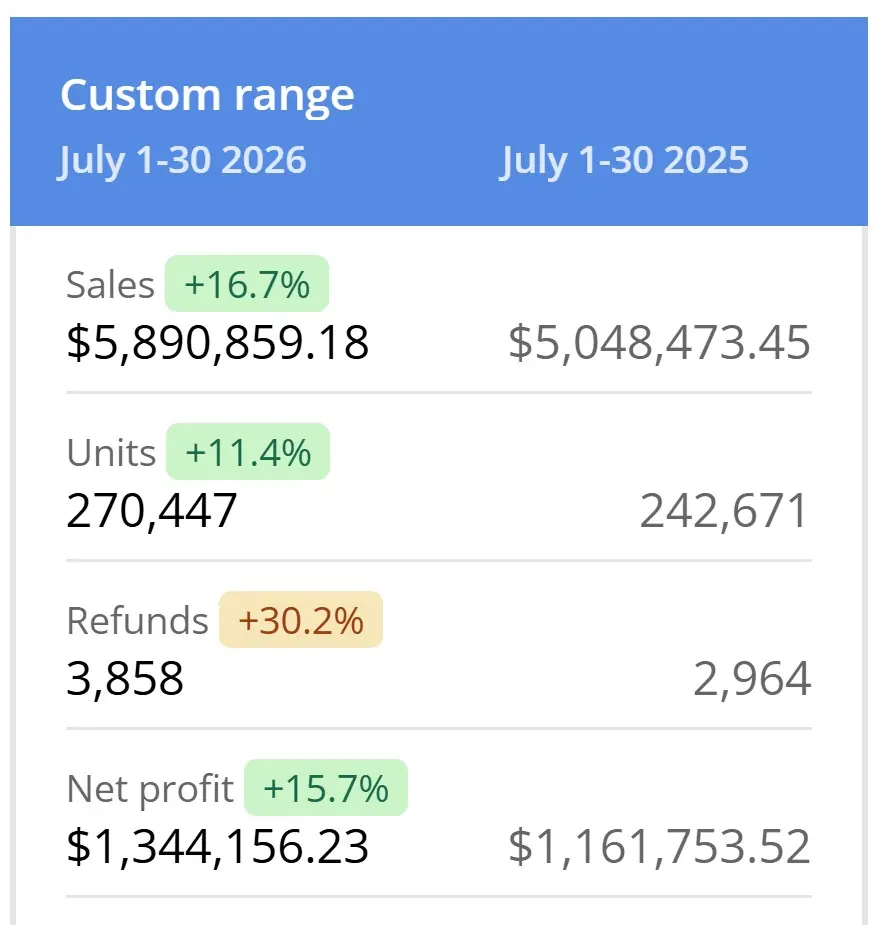
Amazon Profit dashboard, July this year against July last year
Profit dashboard comparing July 2026 with July 2025
Amazon · July year on year

And it held through July, against a July that was already strong

Beating one weak month proves nothing. July 2025 was not weak, and a year later July 2026 still came in 16.7% ahead of it, with net profit up 15.7% on top. Growth measured a year apart, on an account already turning over five million dollars in the month.

July sales
$5.89M
from $5.05M a year earlier
Units
270,447
from 242,671
Net profit
$1.34M
from $1.16M
Amazon Revenue, ad spend and units, month by month for thirteen months
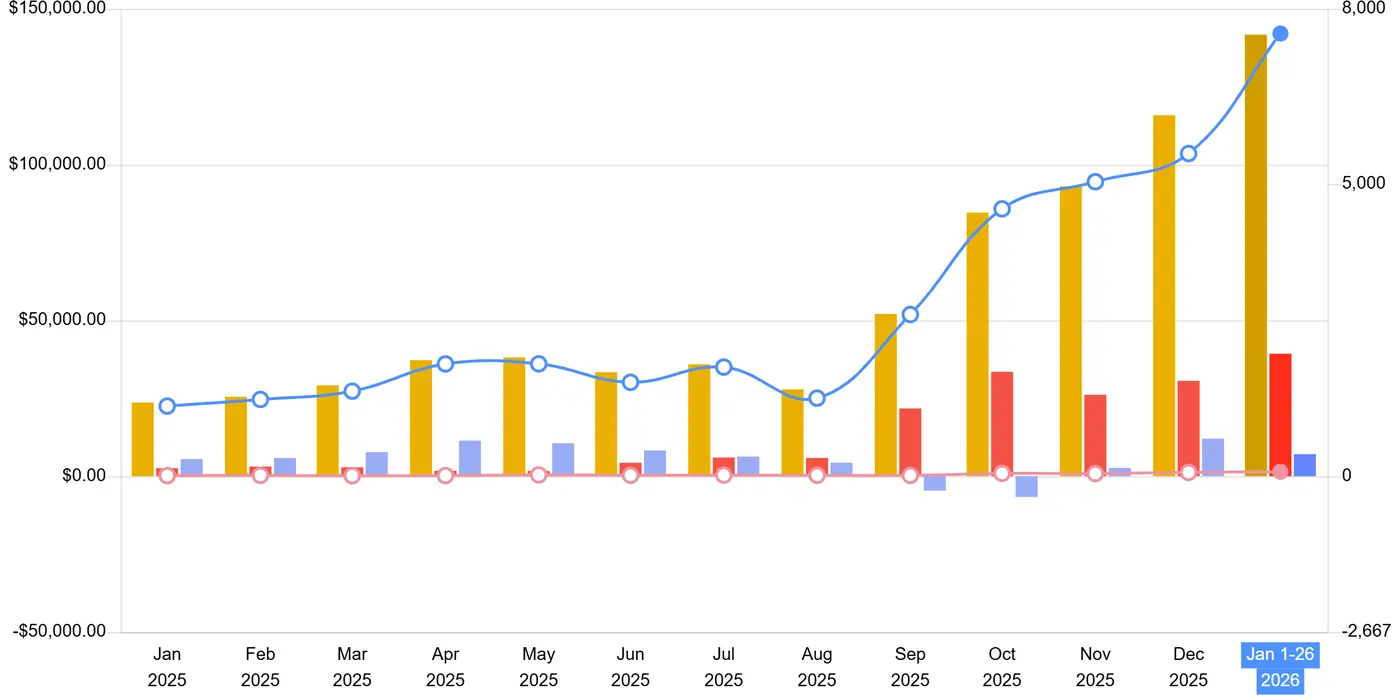
Monthly revenue, ad spend and units from January 2025 to January 2026
Amazon · thirteen months

Flat for eight months. Then the advertising went in properly.

Gold is revenue, red is ad spend, the line is units. The account sat between twenty and thirty seven thousand a month for most of 2025 and nothing about the products changed. Spend went in with a plan behind it in September. By January the account was clearing six times where it started.

Monthly revenue
$140K
from $23K
Units a month
7.4K
from 2.0K
Growth
6x
13 months
02

Amazon PPC

Advertising console screens. Where useful, the console sits next to the business report for the same dates so TACOS can be read rather than asserted.

Amazon PPC Advertising console, every day the account has run
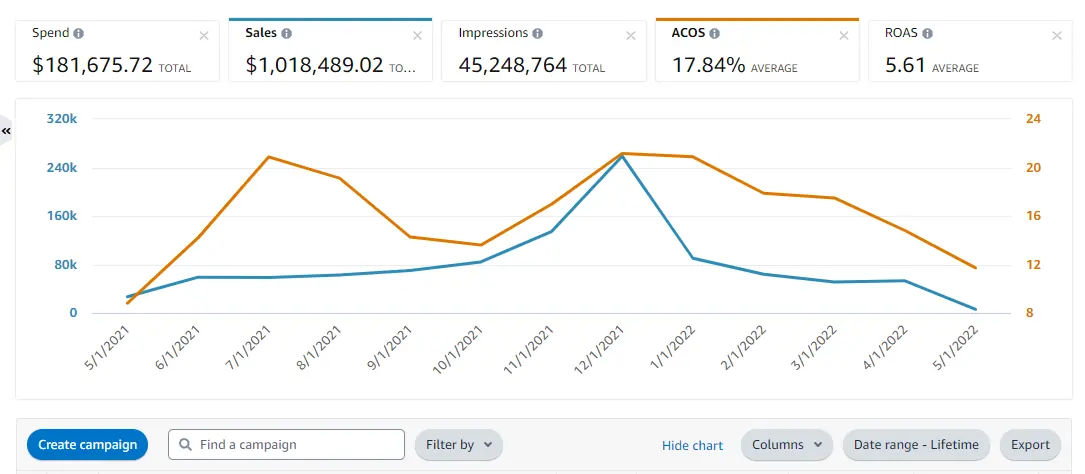
Advertising console, lifetime account view at 17.84 percent ACOS
Amazon · lifetime account view

A million dollars of ad sales, bought for a hundred and eighty one thousand

Not a cherry picked fortnight. This is every day the account has run: forty five million impressions, $1,018,489 of advertising revenue at an average ACOS of 17.84%, and a 5.61 return on every dollar in.

Ad sales
$1.02M
$181,676 spend
ACOS
17.84%
lifetime average
ROAS
5.61x
45.2M impressions
Amazon PPC Advertising console above, the same thirty days of total sales below
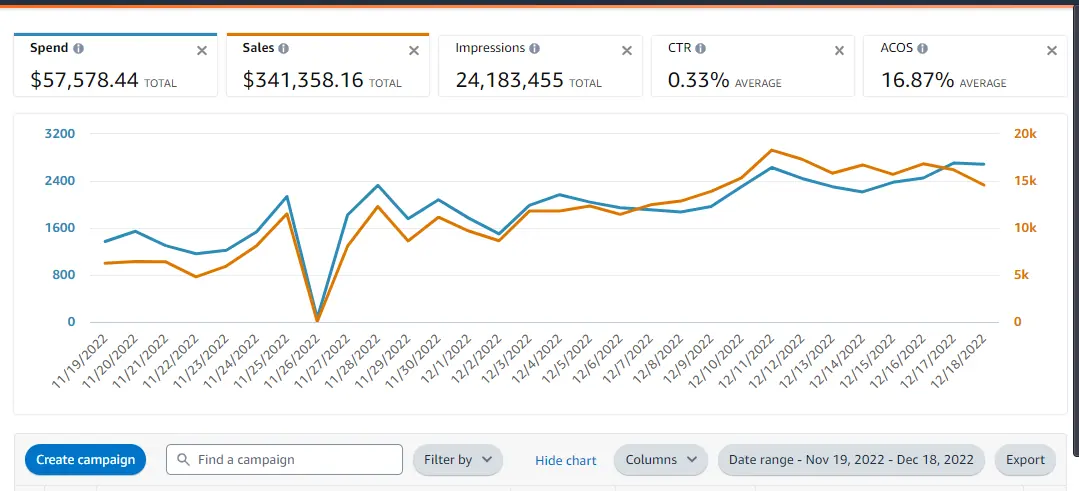
Advertising console showing 16.87 percent ACOS Business report sales snapshot showing 663,289 dollars of ordered product sales
Amazon · thirty days · two screens

Advertising paid for half the revenue. The other half arrived free.

Top screen is the advertising console: $57,578 of spend returning $341,358 at 16.87% ACOS. Bottom screen is the same thirty days in the business report, where total sales came to $663,289. Subtract one from the other and you find the organic sales the ad spend built. TACOS 8.68%. That gap is the entire point of the job.

ACOS
16.87%
$57,578 spend
TACOS
8.68%
spend over total sales
Account sales
$663,289
19,615 units
Amazon PPC Advertising console above, the same thirty days of total sales below
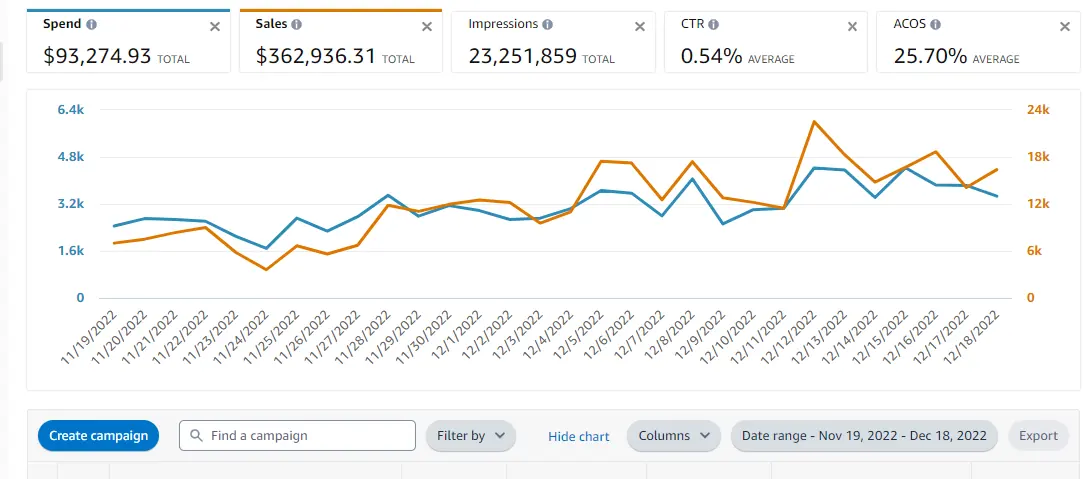
Advertising console showing 25.70 percent ACOS Business report sales snapshot showing 473,834 dollars of ordered product sales
Amazon · same thirty days, different account

Run deliberately hot, on purpose, and correctly

Identical date range to the account above, and nearly three times the TACOS. This one was taking share rather than defending it, so the target was set high on purpose: click through rate ran at 0.54% against the other account's 0.33%, and the brand banked $473,834 in a month. An agency that quotes you one TACOS number has not looked at your margins.

ACOS
25.70%
$93,275 spend
TACOS
19.69%
by design
Account sales
$473,835
13,261 units
03

Amazon DSP and Full Funnel

Bought on audience rather than keyword. Judged on new to brand sales and reach, not on ACOS, because reaching people who already know you is what search is for.

Amazon Advertising console, one week across the whole funnel
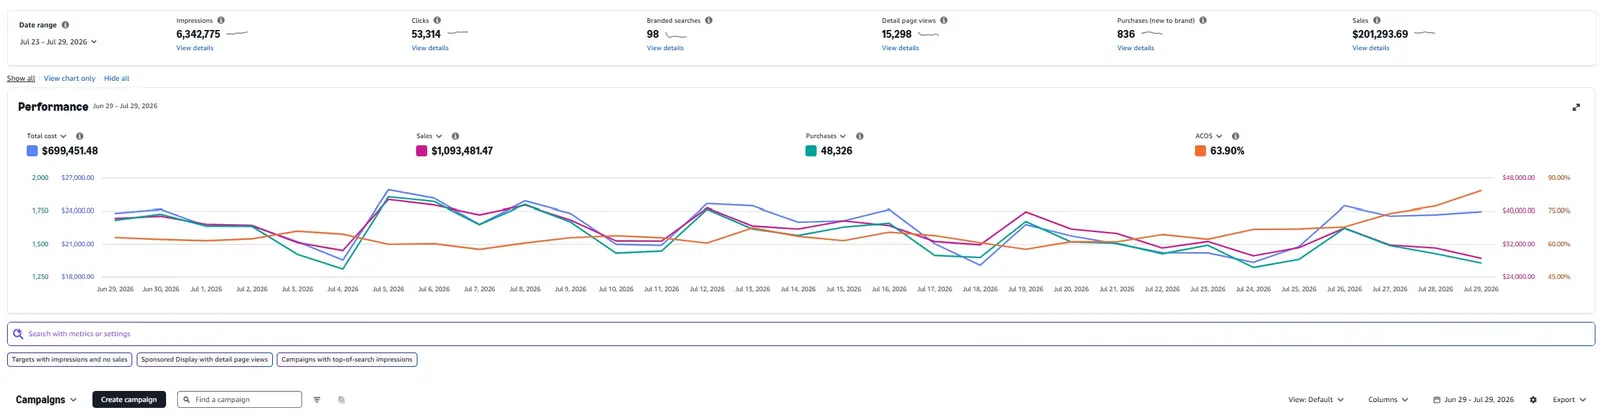
Advertising console, one full funnel week with 836 new to brand purchases
Amazon · seven days

Eight hundred and thirty six buyers who had never bought the brand before

Six and a third million impressions inside a single week, 53,314 clicks and 15,298 detail page views. The number that matters is at the far right of the strip: 836 new to brand purchases. That is what a funnel looks like when the top of it is actually being fed.

Impressions
6.34M
one week
New to brand
836
purchases
Week sales
$201,294
15,298 page views
Amazon DSP Goal performance, cost against sales and new to brand sales
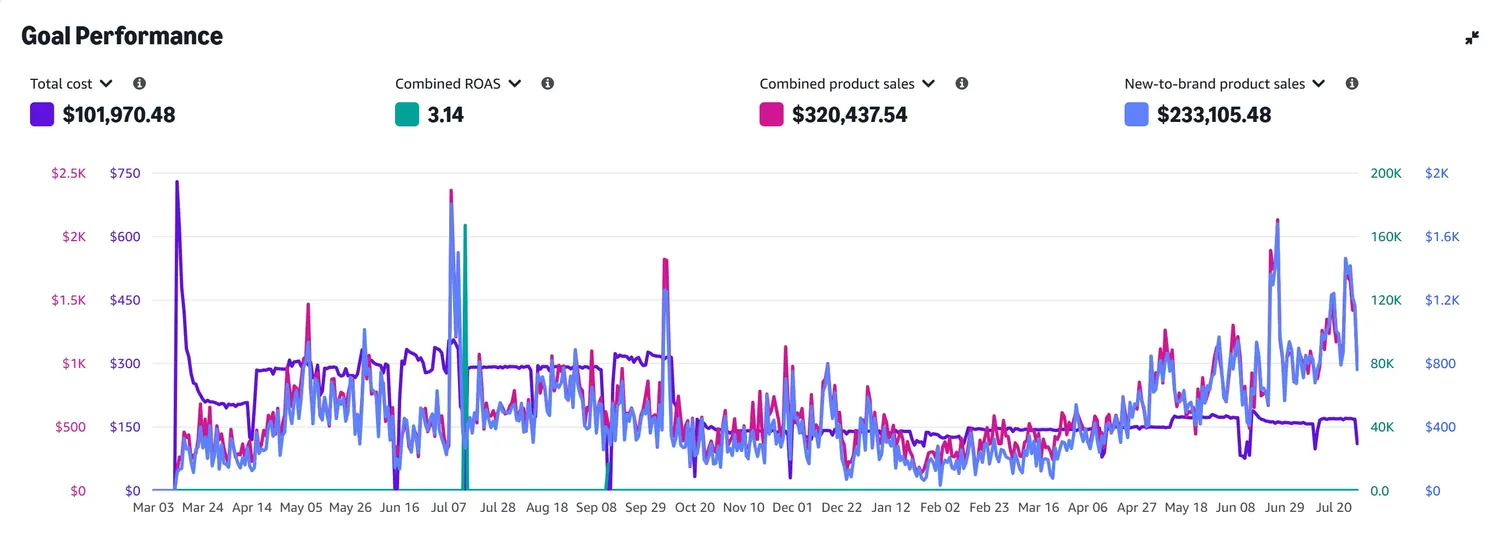
Amazon DSP goal performance, seventeen months, 3.14 combined ROAS
Amazon DSP · seventeen months

Nearly three quarters of the sales came from people who had never bought the brand

Every day the DSP has run, March 2025 to July 2026: $101,970 of media returning $320,437 in combined product sales at a 3.14 combined ROAS. The line that matters is the one on the right. $233,105 of that, 72.7%, is new to brand — buyers who had not purchased from this brand in the previous twelve months. Search almost never finds those people.

Media cost
$101,970
17 months
Product sales
$320,438
3.14 combined ROAS
New to brand
$233,105
72.7% of all sales
Amazon DSP Goal performance, one month of cost, ROAS and new to brand sales
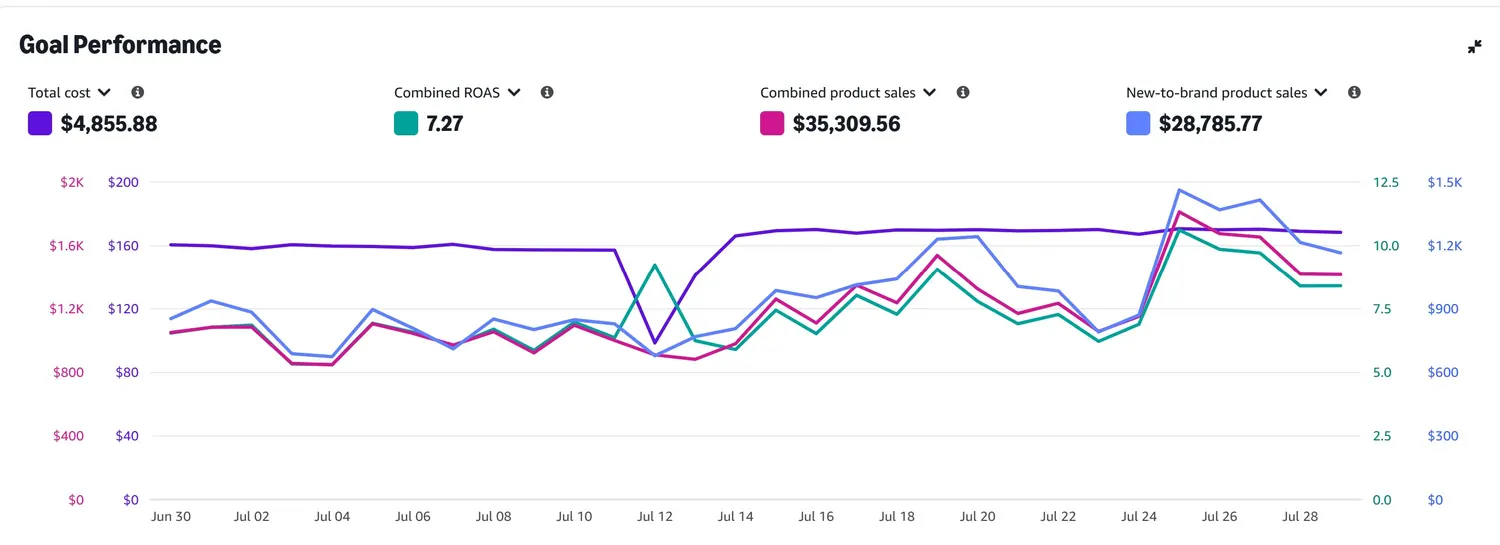
Amazon DSP goal performance, thirty days, 7.27 combined ROAS
Amazon DSP · thirty days

Seven dollars of product sold for every one spent, and four fifths of it brand new

A single month on a tuned account: $4,856 of media returning $35,310 at a combined ROAS of 7.27. $28,786 of it, 81.5%, new to brand. That is the shape a healthy DSP takes once the audiences are right: a small, steady media line on the left of the chart and the sales lines climbing away from it.

Media cost
$4,856
thirty days
Combined ROAS
7.27x
$35,310 sales
New to brand
$28,786
81.5% of all sales
04

Organic Rank

What the ad spend bought that you stop paying for. Real daily positions, search terms masked because they belong to the client.

05

Meta Ads

Ads Manager exports with the results row at the bottom of the screen, so the totals are the platform's arithmetic rather than ours.

Meta Ads Ads Manager, spend against purchase value and purchase ROAS
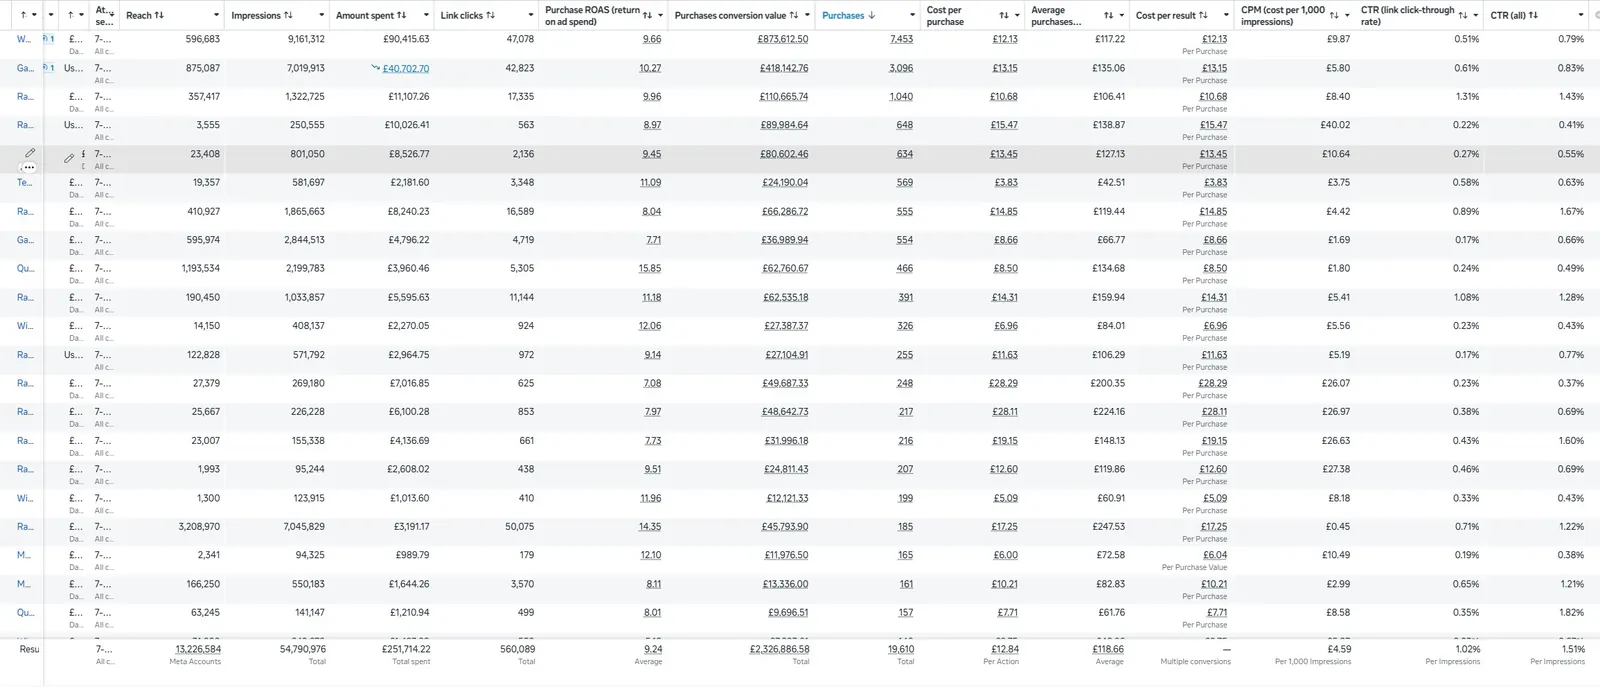
Meta Ads Manager, spend against purchase value and purchase ROAS
Meta Ads · every campaign, since 2023

Nine pounds back for every pound spent, over a quarter of a million in spend

Not a good month lifted out of a bad year. This is every campaign that has ever run, totalled by Meta on the results row at the bottom of the screen: £251,714 spent, £2,326,886 of purchase value, 19,610 purchases at an average order value of £118.66, and 54.8 million impressions reaching 13.2 million people. Blended purchase ROAS of 9.24.

Spend
£251,714
since 2023
Purchase value
£2.33M
19,610 purchases
Purchase ROAS
9.24x
£118.66 average order
Meta Ads Ads Manager, the campaigns carrying the account
Meta Ads Manager, the campaigns carrying the account
Meta Ads · the campaigns carrying it

Purchases bought at ten pounds sixty seven, at eight and a half times return

The campaigns doing the work, isolated: £62,293 of spend, 8.65 million impressions, 87,131 link clicks and 5,838 purchases worth £532,151. Cost per purchase £10.67. The two best lines returned £165,740 and £180,324 between them.

Spend
£62,293
period
Purchase value
£532,152
8.54x ROAS
Cost per purchase
£10.67
5,838 orders
06

Walmart Connect

Sponsored Products and Search Brand Amplifier on the second US marketplace.

07

eBay Ads

Promoted Listings Standard and Advanced, with the ad rate set per listing.

More coming

New accounts are added here as results mature and clients approve the screens. If you want to see work in a category that is not represented yet, ask and we will tell you honestly whether we have it.

Ask About Your Category

Send the right reports. Get a straight answer back.

We read the account properly and write back with where the money is going, what it is buying, and the three things we would change first. You keep it either way.

No obligation · no card · a person replies, usually the same working day

WhatsApp Us
Book a Call Free Audit